Dell Technologies

Driving Growth Through PDP Optimization

Increasing product page engagement in 8% and reducing decision friction

Role

Senior Product Designer

Timeline

2026

Team

Senior Product Designer and cross-functional team

Platform

Dell.com

Role

Senior Product Designer

Timeline

2026

Team

Senior Product Designer and cross-functional team

Platform

Dell.com

Overview

Unclear Content Leads to 20% CSAT

Product Detail Pages attracted high traffic but failed to convert consistently. High bounce rates, elevated DSAT, and content-related confusion (20% of negative feedback) indicated significant decision friction. Users reached PDPs with intent but lacked the clarity needed to confidently purchase, resulting in low conversion rates and measurable quarterly revenue loss.

40% DSAT

Customer Dissatisfaction High

20% DSAT related to content

Specs unclear lead to content misunderstanding

60% Bounce Rate

Customers drop early

Low Conversion

High visits, low CVR

Revenue Impact

Quarterly financing loss

40% DSAT

Customer Dissatisfaction High

20% DSAT related to content

Specs unclear lead to content misunderstanding

60% Bounce Rate

Customers drop early

Low Conversion

High visits, low CVR

Revenue Impact

Quarterly financing loss

Problem

Where users got stuck

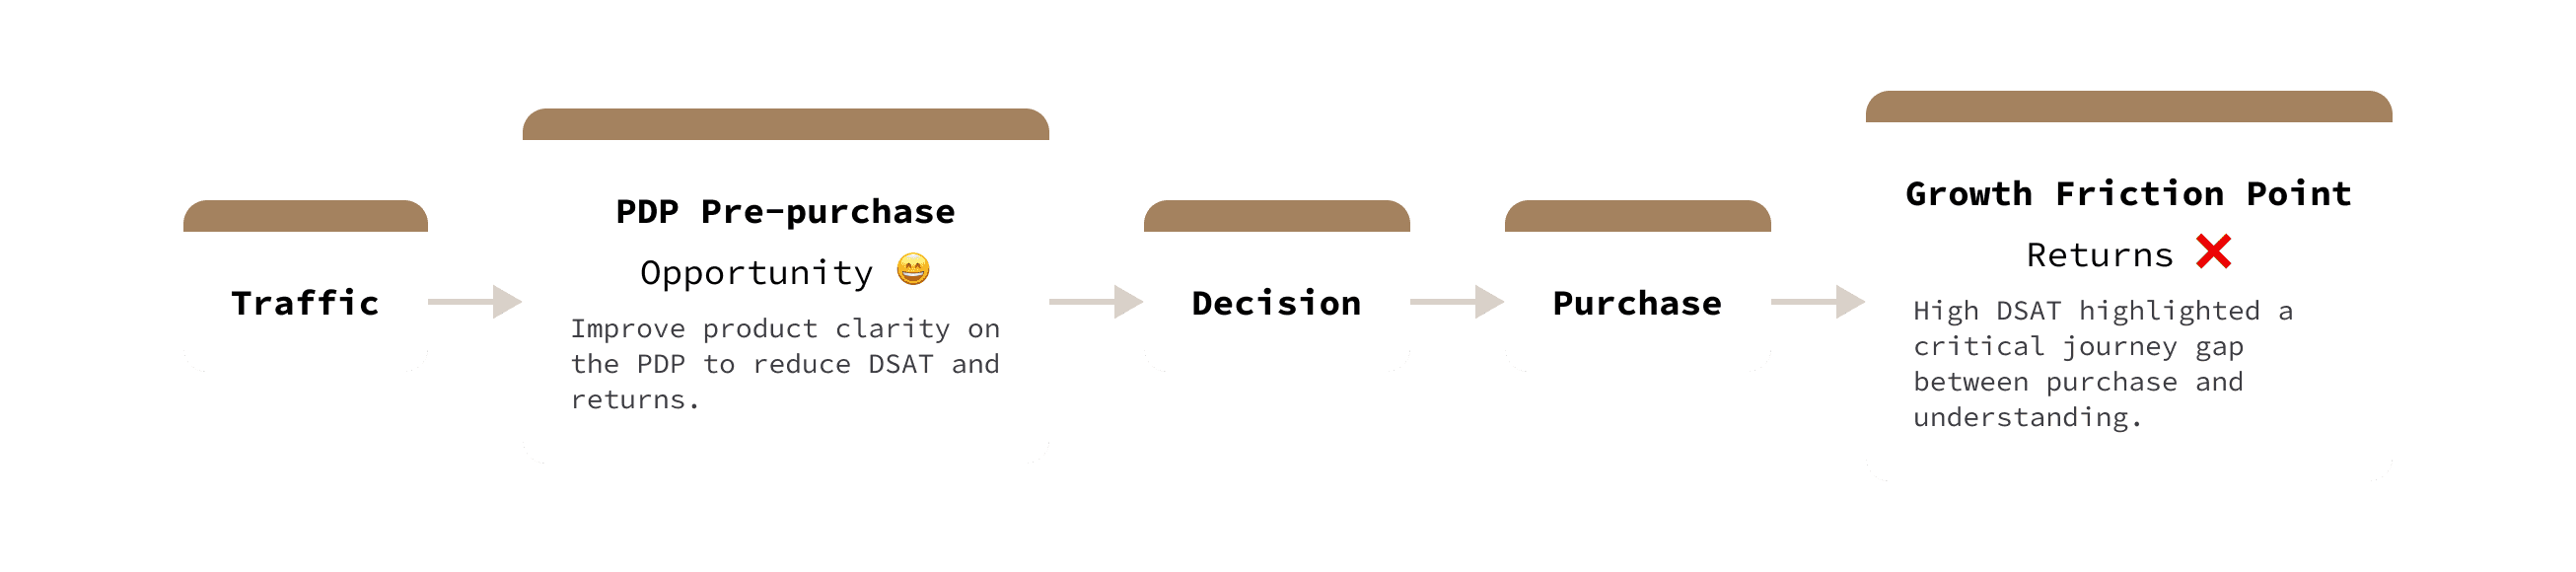
High-intent users reached PDPs but lacked the clarity needed to confidently purchase, resulting in drop-offs, low conversion, high dissatisfaction rates and revenue impact.
Research

Evidence & Benchmarks
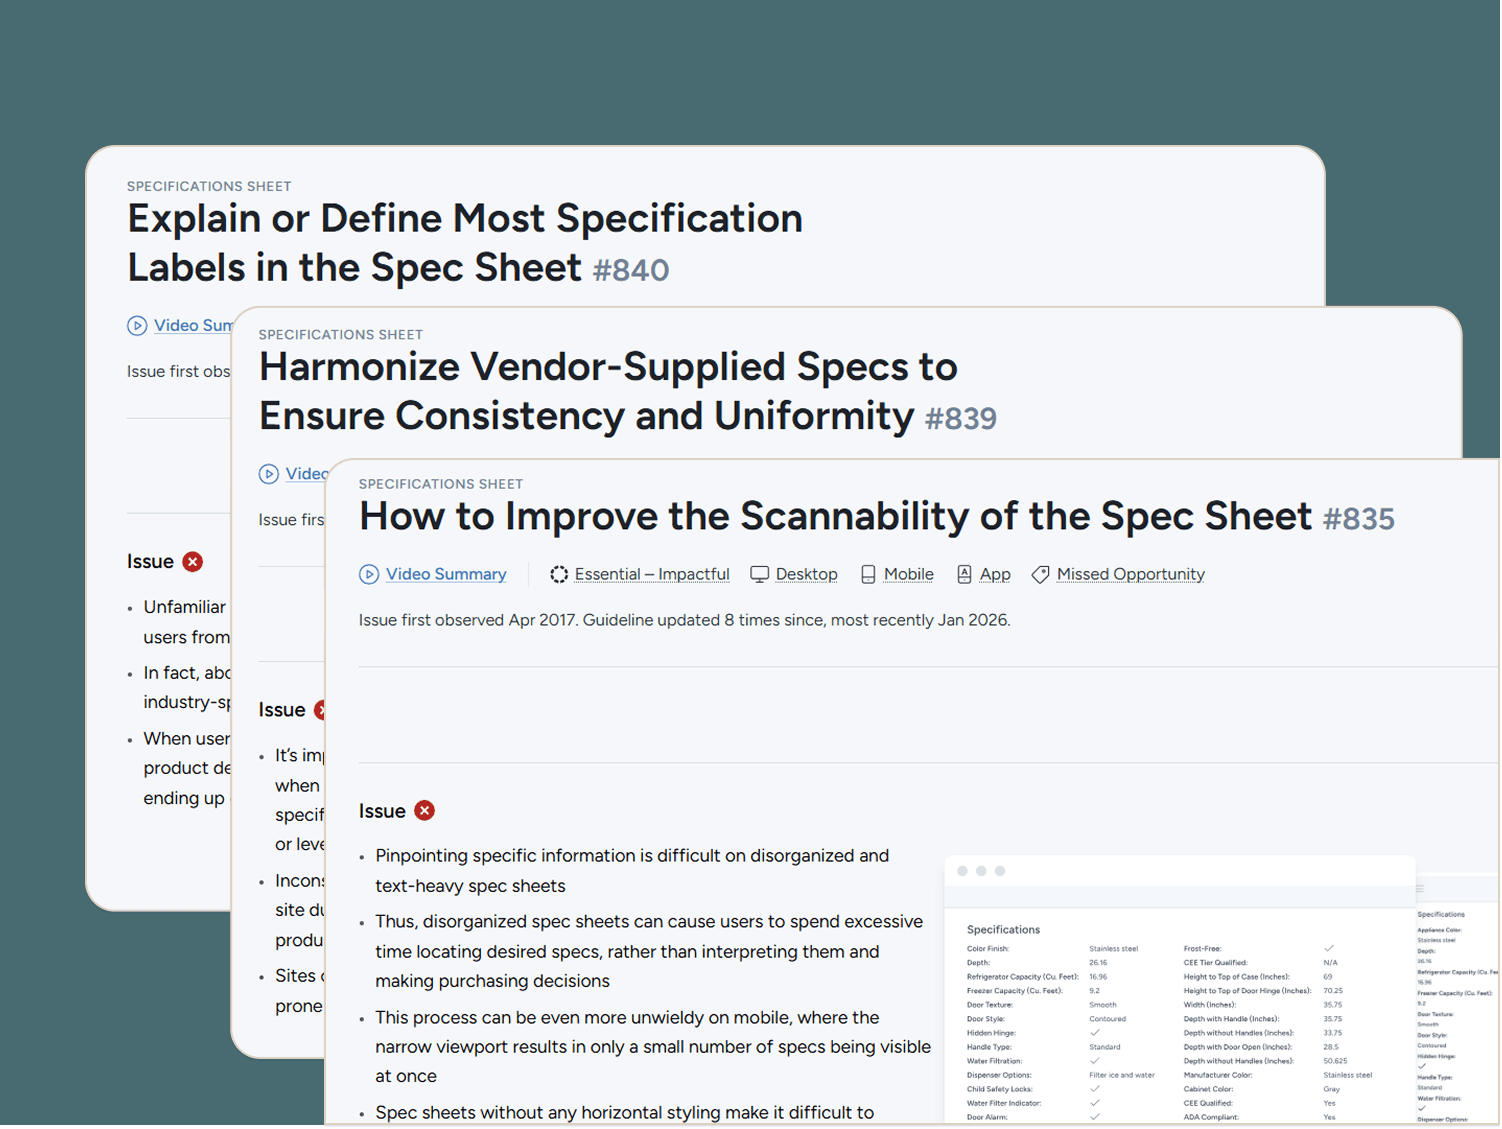
What I learned from the Market

Industry research (Baymard) and competitor analysis reinforced that content clarity and scannable technical specifications are critical drivers of PDP engagement and conversion, validating our focus on information hierarchy and component placement.

  • Baymard Institute research recommends column layouts, clear grouping by category, and improved readability to reduce cognitive load.

  • Leading e-commerce platforms prioritize scannability and progressive disclosure for specs.

  • Competitor analysis revealed clearer grouping of product attributes and comparison cues.

What I learned from the Market

Industry research (Baymard) and competitor analysis reinforced that content clarity and scannable technical specifications are critical drivers of PDP engagement and conversion, validating our focus on information hierarchy and component placement.

  • Baymard Institute research recommends column layouts, clear grouping by category, and improved readability to reduce cognitive load.

  • Leading e-commerce platforms prioritize scannability and progressive disclosure for specs.

  • Competitor analysis revealed clearer grouping of product attributes and comparison cues.

How Research Informed Design Decisions

  • Users scan specs, don’t read → Chunked & grouped specs

  • Too much info causes overload → Progressive disclosure

  • Comparison helps users make decisions → Clear attribute grouping and comparison cues

How Research Informed Design Decisions

  • Users scan specs, don’t read → Chunked & grouped specs

  • Too much info causes overload → Progressive disclosure

  • Comparison helps users make decisions → Clear attribute grouping and comparison cues

Hypothesis

If we improve product clarity by restructuring technical specifications and optimizing the placement of key PDP components, users will better understand the product, feel more confident in their decision, and engage more deeply with the page.

Assumptions

Users are willing to buy but lack clarity. Content hierarchy impacts confidence. Small PDP changes can unlock growth.

Hypothesis

If we improve product clarity by restructuring technical specifications and optimizing the placement of key PDP components, users will better understand the product, feel more confident in their decision, and engage more deeply with the page.

Assumptions

Users are willing to buy but lack clarity. Content hierarchy impacts confidence. Small PDP changes can unlock growth.

Solution

Experiment: Improving Technical Specifications Layout

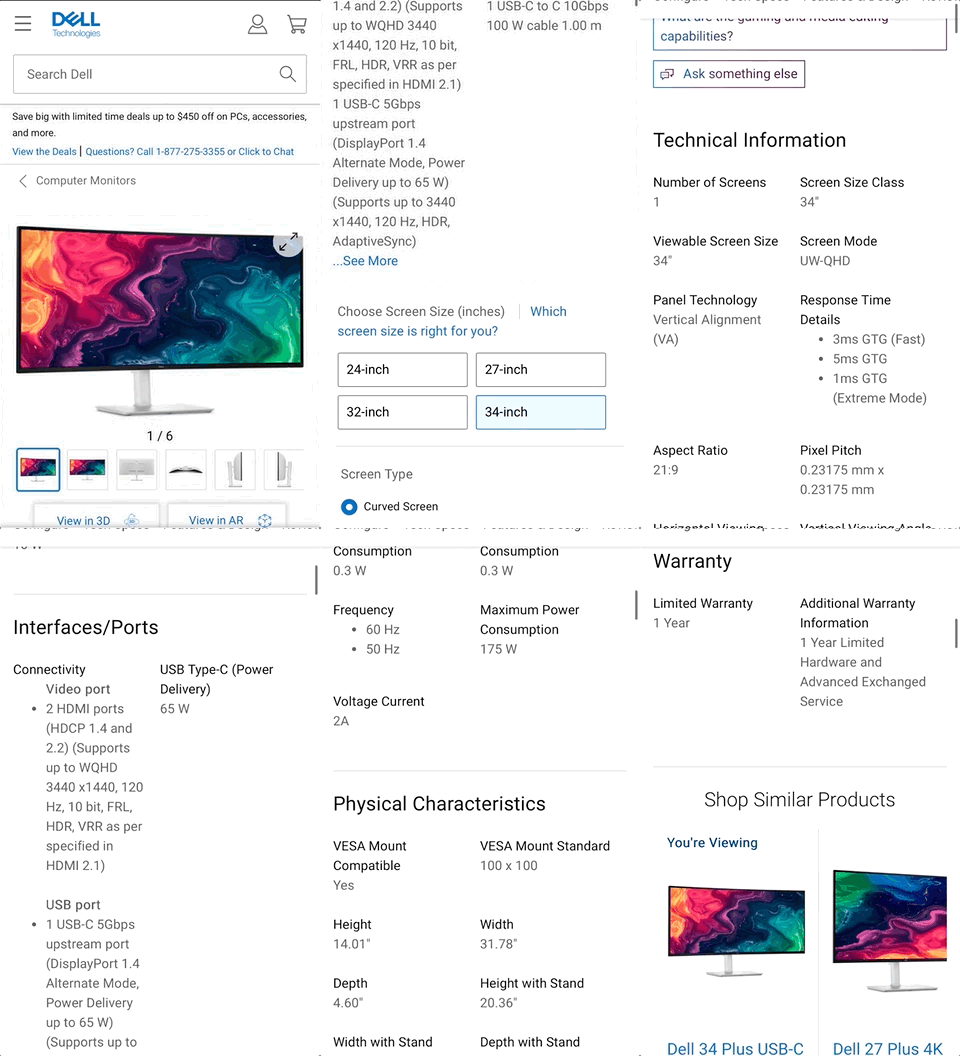
I conducted an A/B test in mobile and desktop comparing the original technical specifications layout with a structured, column-based version informed by industry research. The goal was to validate whether improved readability and grouping would reduce decision friction and increase engagement on PDPs.

01

What I tested

I ran an A/B test comparing the original technical specifications layout with a new structured version, featuring column-based organization, grouped attributes, and improved readability.

02

Why it mattered

Based on Baymard research and behavioral data, I hypothesized that clearer, scannable specs would reduce cognitive load and DSAT rates and support faster decision-making on PDPs.

03

How I measured success

Primary metrics included PDP engagement, interaction with specifications, and downstream conversion signals.

Tech Specs Enhancements

Before:

  • Content increased cognitive load

  • Increased page length

After:

  • Clear grouping by category

  • Improved product clarity and readability

  • Follow UX best practices

Tech Specs Enhancements

Before:

  • Content increased cognitive load

  • Increased page length

After:

  • Clear grouping by category

  • Improved product clarity and readability

  • Follow UX best practices

Shop Similar Products Placement

Before:

  • Placement too low in the page

  • Customers dropped off too soon

After:

  • Placement in the middle of the page between Tech Specs and Feature information

  • Reduced bounce rate

  • Increased 8% engagement in Product Details pages

Shop Similar Products Placement

Before:

  • Placement too low in the page

  • Customers dropped off too soon

After:

  • Placement in the middle of the page between Tech Specs and Feature information

  • Reduced bounce rate

  • Increased 8% engagement in Product Details pages

Results

Key Outcomes & Results

2%

Reduction in content-related dissatisfaction from 20% to 18% in live A/B test

8%

Increase in Product Detail Page engagement, driving longer page and site sessions

5%

Reduction in Bounce Rate, keeping users engaged longer

2%

Reduction in content-related dissatisfaction from 20% to 18% in live A/B test

8%

Increase in Product Detail Page engagement, driving longer page and site sessions

5%

Reduction in Bounce Rate, keeping users engaged longer

Lessons

Key Learnings

Research and benchmarks are most valuable when used to inform concrete design decisions, not just document insights.

A/B testing is essential to validate hypotheses and prioritize changes that directly impact engagement and conversion.

Improving clarity at the decision point is a powerful growth lever in e-commerce.